Predictive Data Analytics
Predictive Data Analytics Course Sampler
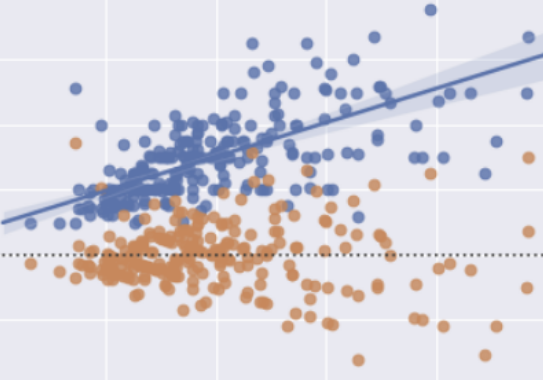
The image on the right shows the result of a linear regression analysis with Python. Many professional Data Analysts use Python and its powerful free libraries as their tool of choice. This minicourse will help you understand why. You will see how easy Python makes reading data from CSV files, and visualizing it in the form of bar charts, pie charts, histograms, box plots, and heat maps. You will also see how easy it is to perform regression analysis and make predictions.